
This article will guide you through the primary features of the Dashboard and Transaction History views.
Dashboard
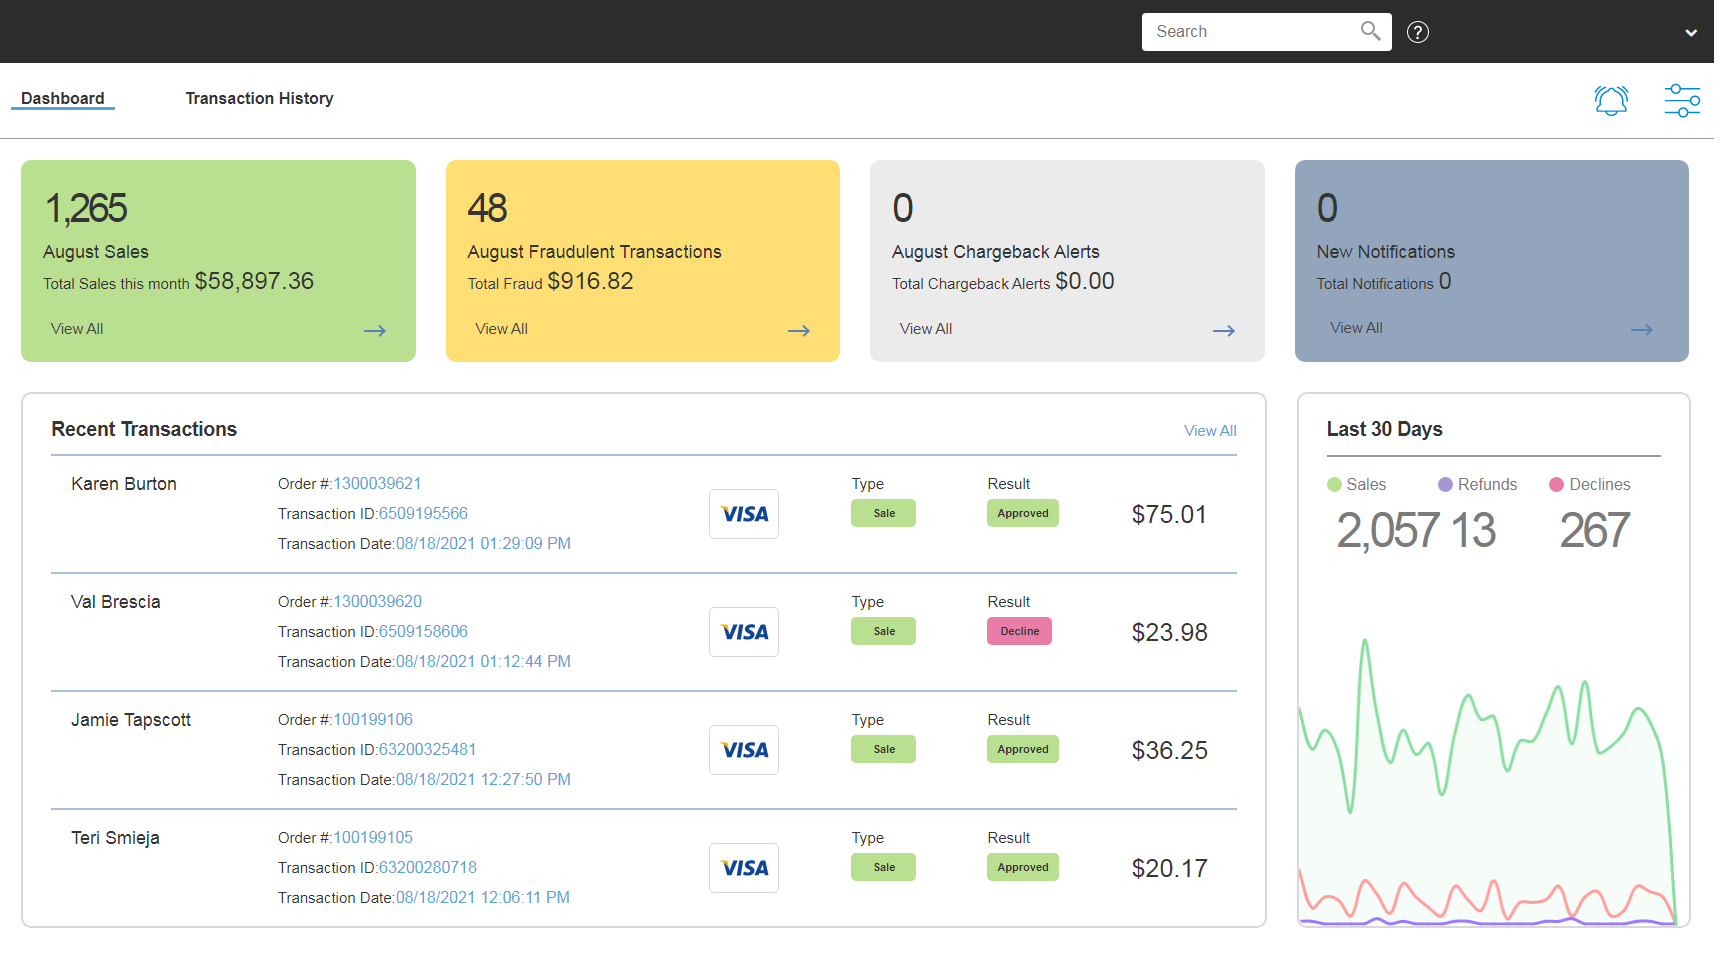
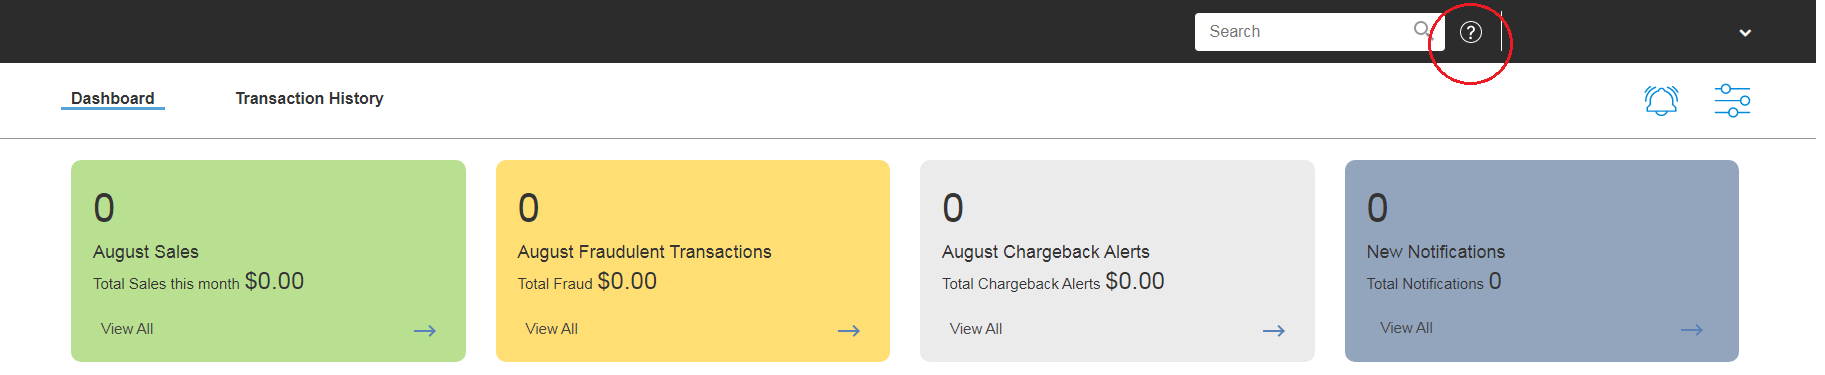
The Dashboard view displays tiles with:
- Sales - month-to-date count and dollar volume of processed sales
- Fraudulent Transactions - month-to-date count and dollar volume of items picked up by the filters
- Chargeback Alerts - month-to-date count and dollar volume (if chargeback alerts are enabled)
- Notifications - count of your new (unread) notifications and total notifications
Clicking on the View All on each tile will show a filtered list of the transactions associated with that tile.
The Dashboard view also displays the four most recent Transactions and a graph view of your Sales, Declines and Refunds over the last 30 Days.
Transaction History
The Transaction History view displays all of the Transactions. The screen will load perpetually if you scroll down and reach the end of the list and will stop if you're on the last entry.
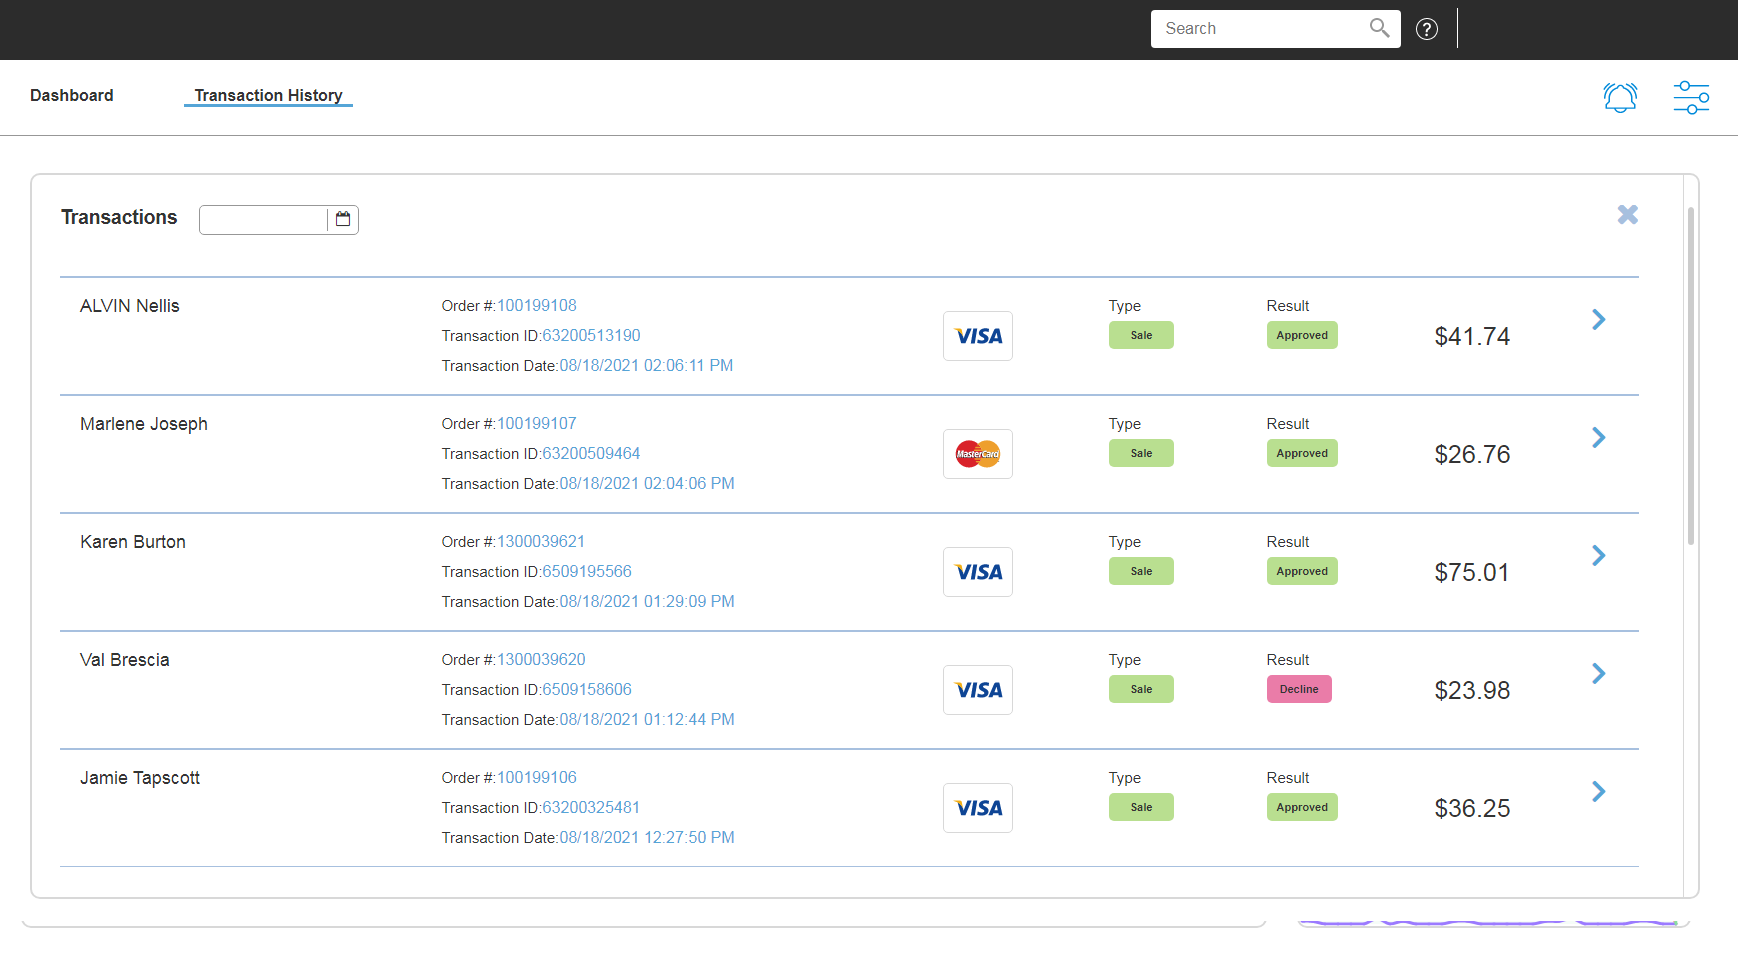
We can Filter the Transactions by date by clicking the calendar on the upper left.
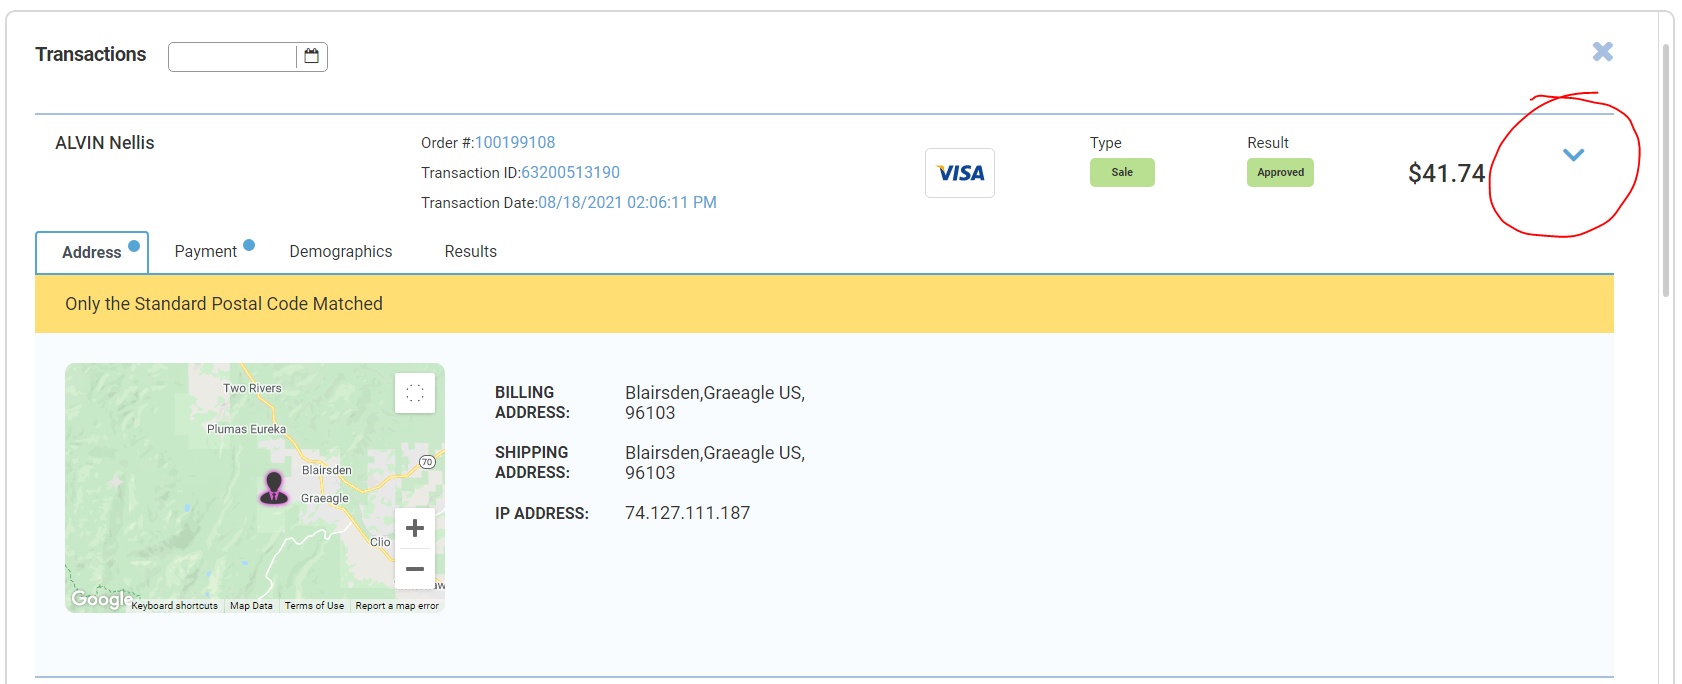
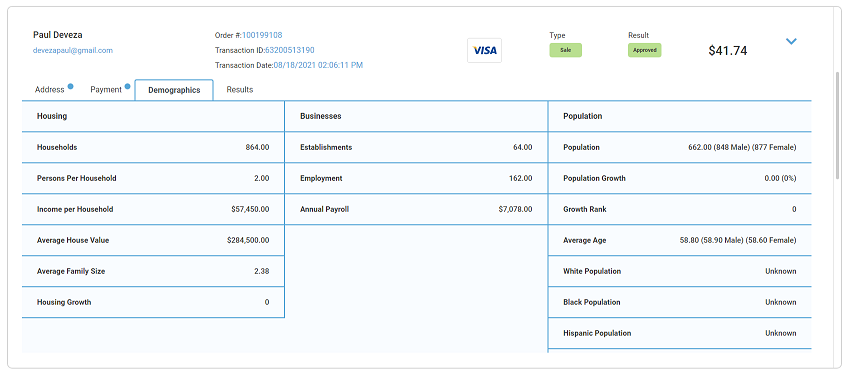
For each transaction, clicking on the right arrow expands the view to displays more information about the specific transaction. The Address Tab displays the Billing and Shipping Address with a location map that you can zoom in/out. This also displays your customer's IP address.
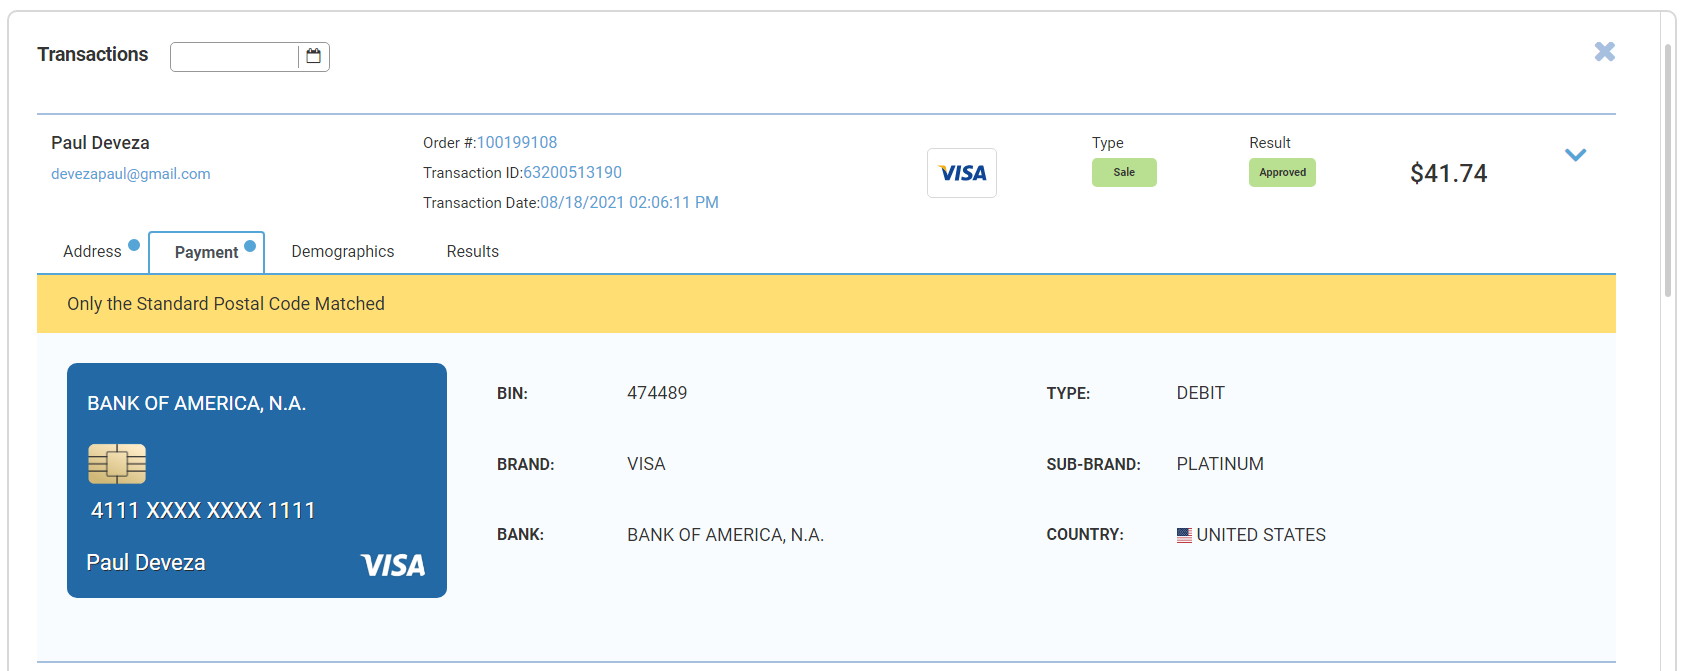
The Payment Tab displays the Payment Information such as Card Type, Brand and Country.
The Demographics Tab displays the Demographics Data such as number of households in the community, Person and Income per household etc.
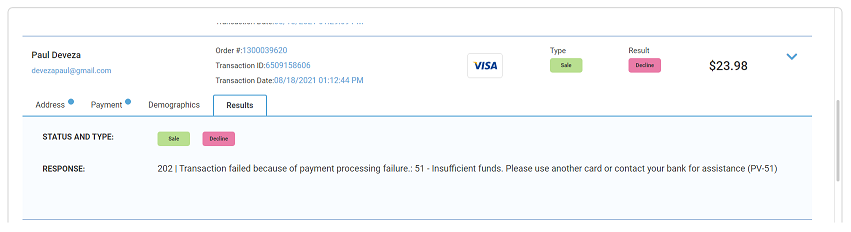
The Results Tab shows us the Type of the Transaction. For a Declined or Error Transaction, it will also display the Decline Reason.
Knowledgebase
There a several articles to assist with the use of the system. The Knowledgebase articles can be accessed by clicking the Help (?) icon.
Comments
0 comments
Please sign in to leave a comment.